Easysoft ODBC-ODBC Bridge User's Guide - Reporting and Statistics
The Easysoft ODBC-ODBC Bridge provides a suite of performance management reports and statistics that allow you to monitor and manage your system.
Chapter Guide
Introduction
One of the most frequent requests that Easysoft receive from enterprise customers is for greater reporting and statistics, so that they can see exactly what the OOB Server is doing at any time.
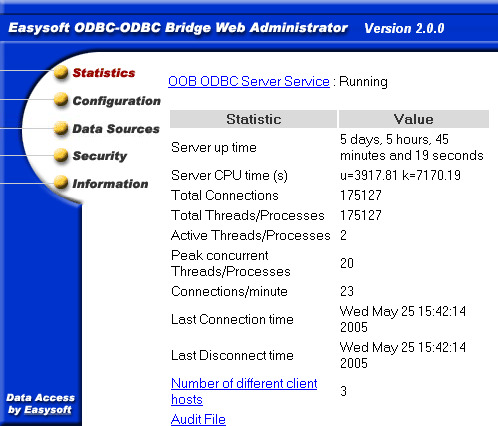
The Web Administrator Statistics screen displays a number of statistics detailing server up time, total connections, total successful connections, active threads/processes, peak concurrent threads/processes and the time of the last connect or disconnect:
Figure 67: General data on the Web Administrator Statistics screen
The Statistics Screen
The Web Administrator Statistics screen provides the following information:
- Server up time -The time in days, hours, minutes and seconds since the OOB Server was started.
- Server CPU time(s) - This is only visible if the ShowProcessTime option on the Configuration screen (see ShowProcessTime) is selected. One or more values are shown. If only one value is shown, it is the total CPU time consumed by the OOB Server. If two times are shown, the first is the user time and the second is the kernel time. Note that the CPU times shown include CPU time consumed by the ODBC Driver Manager, any ODBC drivers and any child processes.
- Total Connections - The total number of connections (or attempted connections) to the OOB Server. This includes connections dropped due to invalid license keys or insufficient license slots, port scanners or anyone using telnet to access the OOB Server ODBC port.
- Total Threads/Processes - The total number of threads or processes that the OOB Server has created during its execution. Connections denied access because of a Server access control rule (but not a DSN access control rule) or because the value of either MaxThreadCount (see MaxThreadCount) or MaxClientConnect (see MaxClientConnect) has been exceeded do not count because the OOB Server does not start a thread/process for these.
- Active Threads/Processes - The total number of active threads or processes the OOB Server has created to handle ODBC connections. However, this number may exceed the actual active count, as the OOB Server only looks for exited threads and processes when five seconds has elapsed without any connections or every 10 connections (to give preference to incoming connections). Note that if MaxThreadCount (see MaxThreadCount) or MaxClientConnect (see MaxClientConnect) is set to anything other than 0 then the OOB Server has to reap exited threads and processes every time a new connection arrives. In this case, the active count will always be up to date immediately after an ODBC connection from a client.
- Peak concurrent Threads/Processes - The maximum value recorded in the Active Threads/Processes field.
- Connections/minute - The Server up time (in minutes) divided by the number of Total Threads/Processes. This is a very useful measure of how busy the OOB Server itself is. However, if you are using persistent connections from your client application you should realise that this number is likely to always be low, since connections are being reused by your client.
- Last Connection time - The time of the last ODBC connection.
- Last Disconnect time - The time of the last disconnect.
- Number of different client hosts - The number of different client machines which have connected to the OOB Server (where a client machine is identified by its IP address). You can click on this link to get a list of IP addresses or machine names. Machine names are only displayed if you have ReverseLookup enabled (see ReverseLookup).
- Audit File - A link to another page which shows entries from the last audit trail file. As the audit trail file is renamed every day you will also see links to older audit trail files. Graphs of connections per hour and connections per minute are available for each audit file. Note that an audit trail file is only produced if AuditODBCAccess is enabled (see AuditODBCAccess).
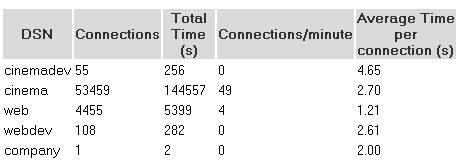
- DSN statistics - Shows the first ten DSNs accessed over the Easysoft ODBC-ODBC Bridge, the number of times a connection to this DSN has been opened, the total time (in seconds) connections to this DSN have been open, the connections per minute and the average time per connection. Note that the total time is concurrent time (i.e. if the same DSN is open twice concurrently for ten seconds, Total time shows 20 seconds).
Changing the refresh frequency
The Web Administrator uses a set of template files into which the dynamic data is inserted before sending it back to your browser.
The template file for the Statistics screen is index.html, which is located in the templates directory wherever you installed the OOB Server.
Edit the index.html file and near the top you will see:
meta http-equiv="refresh" content="60"; URL=/index.html
Change the 60 (the refresh time in seconds) to your preferred setting.
|
NB
|
Note that setting the refresh time to a very low value will increase the workload on the OOB Server process which handles HTTP requests. As this may reduce the response time to the Easysoft ODBC-ODBC Bridge ODBC server thread, times much less than 60 seconds are not recommended.
|
DSN statistics
The Easysoft ODBC-ODBC Bridge records each DSN to which it is connected and displays a table of DSN statistics:
Figure 68: DSN data on the Web Administrator Statistics screen
The information shown in the table per DSN is:
- Number of connections to this DSN - By comparing this number for each DSN you can see which is the busiest data source on your server.
- Total time connected to this DSN - This is concurrent time so two concurrent connections, connected for the same 5 seconds registers as 10 seconds total time.
- Connections per minute to this DSN - The server up time (in minutes) divided by the number of connections to this DSN. This includes connections that were refused by the server for various reasons e.g. access control or authentication.
- Average time per connection - The total time connected to this DSN divided by the number of connections to this DSN. If you know your client applications connect, issue some SQL and then disconnect, this is a good measure of how much processing there is for each connection. This number is likely to be higher for client applications using persistent connections, as there may be long periods of connected time where nothing is happening.
Host Statistics
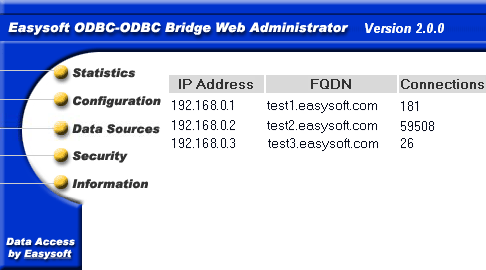
From the Web Administrator Statistics screen there is a link called Number of different client hosts which takes you to a table of statistics per connecting client:
Figure 69: The Web Administrator Client Hosts screen
Information is per client and shows:
- IP Address - The IP address of the client.
- FQDN - The Fully Qualified Domain Name of connecting clients. This is displayed as "unknown" unless ReverseLookup is enabled (see ReverseLookup).
- Connections - The number of connections per client. If you have more than one connecting client then this allows you to see which client is putting the greatest load on your server.
Termination statistics
The contents of the Web Administrator Statistics screen are written on exit to a file called esoob_stats_<dd>_<mm>_<yyyy>_<hhmmss>.stats where <dd> is the day number, <mm> is the month number, <yyyy> is the year number and <hhmmss> is the time in hours, minutes and seconds.
This file will be written into the directory defined by the server configurable parameter LogDir:
Server up time 0 days, 18 hours, 5 minutes and 23 seconds
Server CPU time(s): u=92.66 k=242.72
Total Connections: 58966
Total Threads/Processes: 58966
Active Threads/Processes: 4
Peak concurrent Threads/Processes: 74
Connections/minute: 54
Last Connection time: Wed Jul 04 08:55:13 2001
Last Disconnect time: Wed Jul 04 08:55:12 2001
DSN Connections Total Connections Average
DSN Time(s) per minute Time per
DSN connection(s)
dsn1 3217 4153 2 1.29
dsn2 55566 212747 51 3.83
dsn3 42 8060 0 191.90
dsn4 111 101 0 0.91
Number of different client hosts: 3
192.168.0.1 (test1.easysoft.com)
192.168.0.2 (test2.easysoft.com)
192.168.0.3 (test3.easysoft.com)
Log of Failing SQL
The OOB Server can keep a log of any failed SQLPrepare, SQLExecute or SQLExecDirect functions.
To enable this feature check the LogFailingSQL parameter on the Web Administrator Configuration screen (see LogFailingSQL), which will create a file called oob_sql.log when the first failing SQL occurs.
This file is located in the directory defined by the LogDir parameter on the Web Administrator Configuration screen (see LogDir).
Any future SQL commands that fail are appended to the file once it has been created and you can rename or delete this file at any time.
The failing SQL log file has two types of entry:
[a] an entry showing a piece of SQL which failed:
date time "DSN" SQL text
e.g.
12-04-2002 10:32:55 "test" insert into mytable values (1,2)
---------- -------- ------ --------------------------------
date time DSN name the SQL text which failed
An error may be for a number of reasons, such as the SQL failing to parse correctly, or the database engine being unable to comply (a duplicate key error, for example):
31-07-2001 11:24:24 "example" update Title set Count=Count+1 where id = 1
01-08-2001 09:08:08 "web" select columnnoexist from stores
01-08-2001 09:05:05 "test" update sales set stor_id = 8042 where stor_id = "fred"
01-08-2001 09:06:06 "test" select * from tablenoexist
The DSN name field is extremely useful when identifying problems.
In this example the "web" and "test" DSNs both point at the same database, but "web" is the live version of the application and "test" is used by software developers.
As the client applications are on different machines, the TargetDSN used by the OOB Client is set to "web" on one client and to "test" on the other.
Failing SQL in the log to "test" would not be uncommon as this is under development, but failures for "web" indicate a problem a real user might have experienced running live software.
[b] an entry logging the first database error retrieved AFTER a piece of SQL failed:
date time SQLState="xxxxx", NativeError=nnnn, Msg="xxxxxxxx"
e.g.
12-04-2002 10:32:55 SQLState="23000", NativeError=2627 Msg="[Microsoft][ODBC SQL Server Driver][SQL Server] Violation of PRIMARY KEY constraint"
The failing SQL file is written to as follows:
1. each piece of SQL executed with either SQLPrepare, SQLExecute or SQLExecDirect is documented where those APIs fail.
2. an entry is written in the format in [a] if an SQLPrepare, SQLExecute or SQLExecDirect function fails.
3. if [2] occurs then an entry is written in the format in [b] if the application calls SQLError or SQLGetDiagRec.
4. once the application is finished with the SQL in [1] (or executes more SQL) then the previous SQL is no longer available to log.
This means that failing SQL is written to one line of the failing SQL log, followed by the error text returned from the database engine on the next line.
However, this is NOT always the case, as the failing SQL statements and the error text can get mixed up if the server is very busy (for example, if multiple concurrent connections all fail at the same time).
Auditing
The OOB Server records all activity to an audit trail file if the AuditODBCAccess parameter is checked (see AuditODBCAccess or Changing Server Configurable Parameters under Unix) on Unix).
The Audit File link on the Web Administrator Statistics screen displays a page showing:
- the first page from the current audit trail file.
- links for the current audit trail file to display the previous page, the next page, the first page and the last page.
- a link to each recorded audit trail file.
- two graph links for each audit trail file, one showing connections per minute and another connections per hour over the period of that audit trail file (a new file is opened each day), which show when the OOB Server is busiest (so that better decisions can be made for scheduling administration tasks that require taking the server down, for example) and highlight unexpected bursts in activity (e.g. a search robot cataloging your web site).
Audit File Description
The current Audit File is called esoob_access.log and will be placed in the directory specified by the server configurable parameter LogDir.
Here is an example of a few lines from the audit file:
Mon, 02 Jul 2001 15:01:07 GMT CONNECT 192.168.0.1(test1.easysoft.com)
Mon, 02 Jul 2001 15:01:12 GMT DISCONNECT 192.168.0.1(test1.easysoft.com)
Fri, 06 Jul 2001 13:10:46 GMT AUTH_DENIED 192.168.0.1(test1.easysoft.com)
Fri, 06 Jul 2001 14:34:36 GMT REFUSED_BY_DSN_RULE test(Martin Evans)
Fri, 06 Jul 2001 15:18:34 GMT REFUSED_MAXCLIENTCONNECT 192.168.0.3(unknown)
Fri, 06 Jul 2001 15:19:33 GMT REFUSED_MAXCONCURRENT 192.168.0.2(test2.easysoft.com)
Mon, 09 Jul 2001 13:04:02 GMT REFUSED_BY_RULE 192.168.0.1(test1.easysoft.com)
The fields in each line of the audit file are:
- day - the day of the week
- day number - the day of the month
- month - the month name
- year - the year
- time - hours, minutes and seconds (colon separated)
- timezone - the time zone
- event - an event code (see Graph Generation)
- event arguments - details of the client, DSN or user name (see Graph Generation)
The events and their descriptions are:
- CONNECT -An OOB Client has connected to the OOB Server. This does not mean the client gained successful access to the ODBC data source, but that the server accepted the connection. If the OOB Server Authentication_Disabled parameter was not set (seeThe Configuration Screen) then the client was authenticated by the operating system and also completed any access control test based on its IP Address. The last field of the audit file shows the client IP address and also the client FQDN in brackets if the ReverseLookup parameter is enabled (see ReverseLookup).
- DISCONNECT - An OOB Client disconnected from the OOB Server. The audit file does not indicate why the client disconnected. The client may have called SQLDisconnect, simply been interrupted, or the OOB Server could have timed out the connection because it was inactive for the number of seconds set in the TimeOut parameter (see The Configuration Screen).
- AUTH_DENIED - This event happens when an OOB Client connects to the OOB Server, OOB Server authentication is enabled and the client passes an invalid user name/password (LogonUser/LogonAuth) pair for the operating system. The OOB Server has turned down the connection request.
- REFUSED_MAXCLIENTCONNECT - The connection attempt has been turned down. The OOB Client attempting connection to the OOB Server already has too many open connections. The OOB Server limits the connections from a particular client to MaxClientConnect (see The Configuration Screen).
- REFUSED_MAXCONCURRENT -The connection attempt has been turned down. There are already too many open connections as defined by MaxThreadCount (see The Configuration Screen).
- REFUSED_BY_RULE -The connection attempt has been turned down due to an client access control rule defined in the server on the Web Administrator Security screen.
- REFUSED_BY_DSN_RULE - The connection attempt has been turned down due to a DSN access control rule. These rules are defined in the server on the Web Administrator Security screen.
- SERVER_SUSPENDED - The service was suspended.
- SERVER_RESUMED - The service was resumed.
Daily Renaming
The audit files are renamed once a day at midnight. At midnight the current audit trail file (esoob_access.log) is renamed to esoob_access_<dd>_<mm>_<yyy>.log where <dd> is the day number, <mm> is the month number and <yyyy> is the year number.
The audit file for each day should be visible in the Web Administrator.
Graph Generation
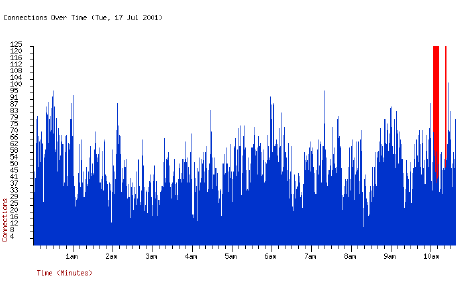
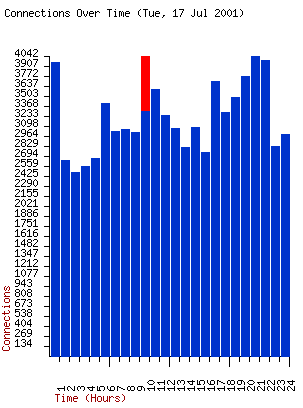
The Web Administrator is capable of analysing a particular audit file and producing graphs of connections per minute and connections per hour for any selected day.
These graphs are accessed from the Audit File link on the Web Administrator Statistics screen.
Connections are displayed as blue bars and warning events are displayed as coloured warning bars on top of the relevant blue bar:
failed connects (Purple bar):
attempts denied access due to access control lists of server limits (Red bar):
- REFUSED_MAXCLIENTCONNECT
- REFUSED_MAXCONCURRENT
authentication failures (Orange bar):
- REFUSED_BY_RULE
- REFUSED_BY_DSN_RULE
Figure 70: The Web Administrator Connections per Minute graph
Figure 71: The Web Administrator Connections per Hour graph
Event Logging On Windows
The Windows OOB Server uses the application event log to record status, diagnostic, and security information. Events logged by the OOB Server include the following:
- The OOB Server was started, stopped, paused, or resumed.
- An attempt was made to access the OOB Server or a data source that was disallowed by an access control rule.
- An attempt was made to access a Web Administrator page that was disallowed because an invalid user name or password was supplied.
- The OOB Server caught an exception.
Much of the information written to the application event log is also written to the OOB Server log files (by default, these are stored in the c:\temp directory). Refer to the application event log if:
- The standard OOB auditing mechanism wasn't enabled for the period that you're interested in.
- You prefer to examine log file entries by using Event Viewer rather than a text editor.
To view the application event log
1. Do one of the following:
- In Control Panel, open Administrative Tools, then open Event Viewer.
- For Windows NT, click Start, click Programs, click Administrative Tools, and then click Event Viewer.
2. In the left hand pane of the Event Viewer window, click Application.
Browsing System Data Sources in the Web Administrator
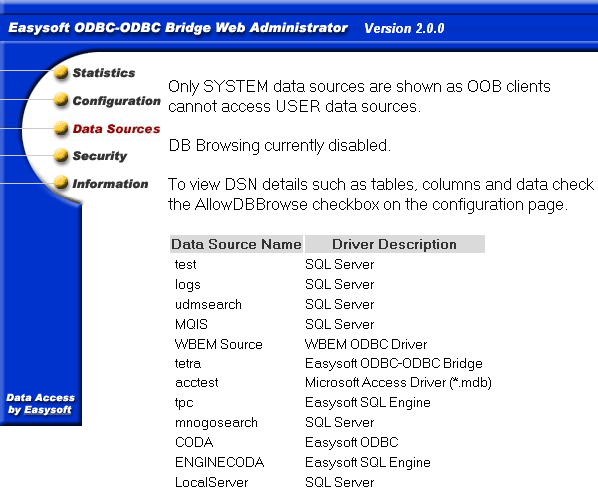
The Web Administrator Data Sourcesscreen displays the ODBC system data sources found by the server and their configured drivers. Note that if the AllowDSNBrowse parameter is disabled, no data source or driver information will display in this page.
Figure 72: The Data Sources screen of the Web Administrator
Viewing data sources, tables, columns and data
The Web Administrator facility lets you browse data sources for lists of tables, table composition and rows of data in the tables.
In order to browse system data sources on the machine where the OOB Server is running you must enable the AllowDBBrowse configurable parameter on the Web Administrator Configuration screen.
This converts the list of data source names on the Data Sources page into links to further pages, allowing you to browse down through the data source and its tables, columns and data.
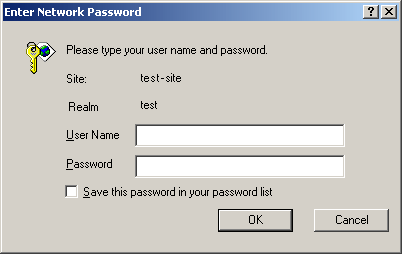
You may be prompted for a database user name and password when first clicking on a DSN.
The OOB Server attempts an initial connection without the ODBC UID/PWD attributes, but if that fails with an authentication error (28000) an authentication challenge will be issued, where the realm is the name of the DSN.
|
NB
|
DSNs cannot be browsed using trusted connections.
|
Figure 73: The DSN Realm Enter Network Password dialog box
Having gained access, DSN details can then be displayed, as in the following example:
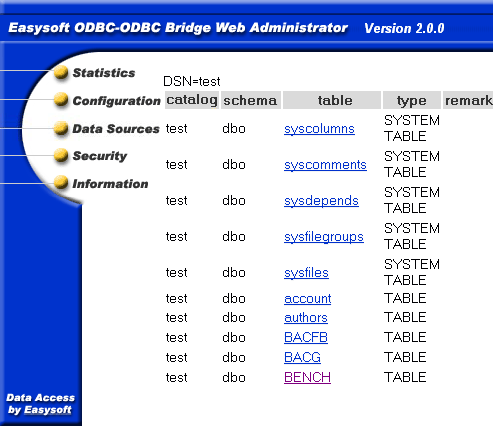
The initial screen displays the tables and views in the DSN test (i.e. it is the result set generated by calling SQLTables when connected to a DSN called test):
Figure 74: The Web Administrator Data Sources screen DSNs
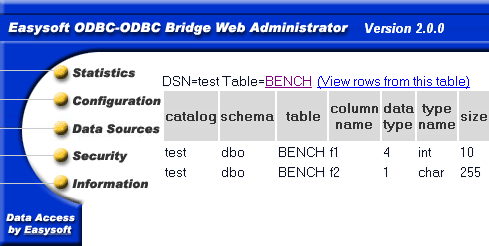
Click on BENCH to display a list of the columns of data in that table (generated by calling SQLColumns on table BENCH in DSN test):
Figure 75: The Web Administrator Data Sources screen DSN data
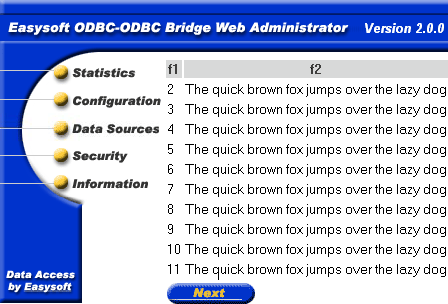
Click on View rows from this table to display the first ten rows in that table (generated by a "select * from BENCH" statement):
Figure 76: The Web Administrator Data Sources screen row data
Click Next or Prevto move forwards or backwards in the result set by ten rows at a time.
Easysoft ODBC-ODBC Bridge Resources
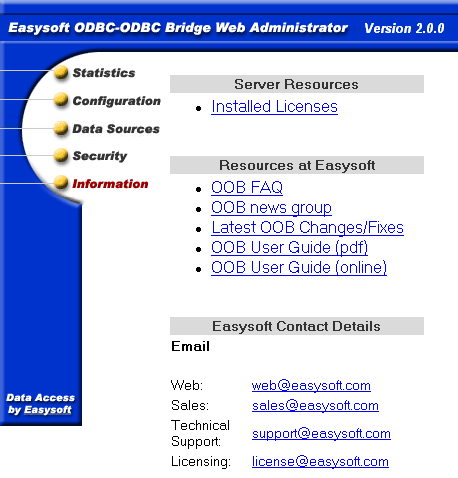
The Web Administrator Informationscreen displays a list of links to Easysoft support resources:
Figure 77: The Information screen of the Web Administrator
- OOB FAQ - a list of Frequently Asked Questions.
- OOB news group - a forum for posting questions and answering questions with other users.
- Latest OOB Changes/Fixes - a document listing any recent product updates.
- OOB User Guide (pdf) - the User Guide in Adobe Portable Document Format.
- OOB User Guide (online) - the User Guide in HTML format.
- Easysoft Contact Details.
Viewable Licenses
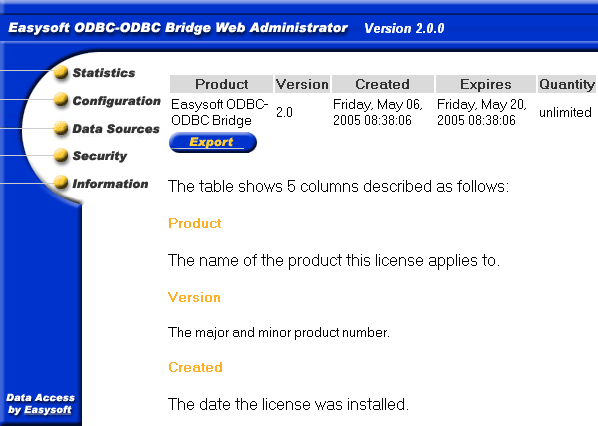
To view all your installed Easysoft licenses, click Information on the main web page followed by the Installed Licenses link:
Figure 78: The Web Administrator Licenses screen
The table shows four columns:
- Product - The name of the product this license applies to.
- Version - The version of the product.
- Created -The date the license was installed.
- Expires -The date the license expires or the string "Never", meaning the license does not expire.
- Quantity - A product specific limit which is either the maximum allowable number of concurrent connections or the string "unlimited", meaning that there is no limit on the number of concurrent connections.
Exporting Licenses
On Windows the Information page also allows you to export the registry entries in RegEdit 4 format to a file called LogDir\easysoft_licenses.reg where LogDir is an OOB Server configurable parameter defined on the Configuration screen.
Click the Export button to export your licenses. If your registry becomes damaged you can restore the license entries by double clicking on the easysoft_licenses.reg file.

